The Relationship of Venn Diagrams to Tree Diagrams--Conditional Events
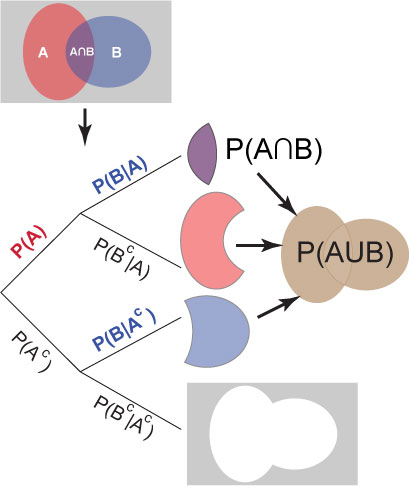
Any probability problem that can be represented by a Venn diagram can also be represented by a tree diagram and vice versa. The diagrams at right are set up for conditional events, but will will look very similar for independent events.
Note that specific leaves on the tree correspond to specific areas of the Venn diagram. This is true for both independent and conditional events.
For Conditional Events:
- P(A∩B) = P(A) • P(B|A)
- P(AUB) = P(A) + P(B) - [P(A) • P(B|A)]
Example:
- P(A) = 49 %, probability of being male
- P(B|A) = 5 %, probability of wearing a pink dress given being male. In other words if the males were separated from the population and one of them were randomly selected, there would be a 5 % chance that he would be wearing a pink dress.
- P(Ac) = 51 %, probability of being female
- P(B|Ac) = 20 % probability of wearing a pink dress given being female. In other words if the females were separated from the population and one of them were randomly selected, there would be a 20 % chance that she would be wearing a pink dress.
- P(A∩B) = 2.45 %, probability of wearing a pink dress and being a male. In other words if a person were randomly selected from the entire population, there would be a 2.45 % chance that the person would be a male wearing a pink dress.
- P(AUB) = 59.2 %, probability of being a male or wearing a pink dress. In other words if a person were randomly selected from the entire population, there would be a 59.2 % chance that the person would be wearing a pink dress.