Chapter 1: The Normal Distribution
I. Exploring Data: (continued).
II. Anticipating Patterns:
C. The normal distribution
Properties of the normal distribution
Using tables of the normal distribution
The normal distribution as a model for measurements
|
Objectives |
||||||||||||||||||||||
Ogives
Homefun (formative/summative assessment): prob. 1,3,5,9 pp.105-106
|
||||||||||||||||||||||
Linear Transforms
Formative assessment: Using the TI-83 calculators and monthly temperature data in Fahrenheit from the Geenville-Spartenburg Airport, calculate and record the mean, median, standard deviation, IQR, range, Q1, and Q3 for both Fahrenheit and Celsius. Convert the recorded Fahrenheit values directly to Celsius. How do the converted values compare to the ones calculated in Celsius.?
Homefun (formative/summative assessment): prob. 19, 21 p. 107 |
||||||||||||||||||||||
The Normal Distribution
Relevance: The normal distribution is ubiquitous. Discussions about it pop up in all kinds of both technical, news, and popular publications. Homefun (formative/summative assessment): prob. 27, 29, 31, 33 pp. 108 - 109
|
| Essential Question: How is the area under the bell-curve related to the standard deviation? |
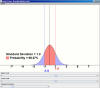
Estimating Areas Under Normal Distributions
- Find probabilities (areas under the curve) using the 68-95-99.7 Rule for normal distributions (sometimes called the empirical rule). Note: in the 1st part of the test for this chapter, you will not be permitted to use calculators or tables. The entire test will be based on the above rule.
Formative assessment: Using the empirical rule evaluate areas under the curve.
Relevance: If you know the empirical rule you can easily double check your answers when solving for areas under the n-distribution. The ability to evaluate answers is a very high level skill.
Homefun (formative/summative assessment): prob. 43, 45 p.131
| Essential Question: Does an ogive give the same information as a normal distribution? |
Relating the Normal Distribution to Ogives
- Convert the N-distribution into an ogive (cumulative
frequency plot) using the empirical rule. (Formative assessment, group work)
Normal Distribution, Wikipedia http://en.wikipedia.org/wiki/Normal_distribution, 9-8-2008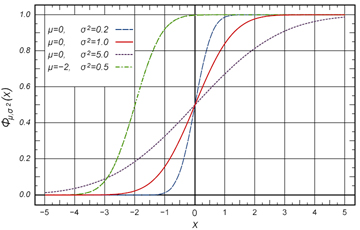
- Estimate the mean, median, sigma, Q1, Q3, and IQR using an ogive for a normal distribution. (Formative assessment, group work)
| Essential Question: How different are the characteristics of non-normal distributions to normal distributions? |
Non-Normal vs. Normal Distributions
- Estimate the median, quartiles, and probabilities for any
distribution by estimating the area under the curve:
- Uniform
- Triangular
- Skewed
-
Be as one with the 0-75-89 Rule based on Chebyshev's Theorem, which applies to any distribution. Tail areas, several standard deviations from the mean, of the normal distribution are often used in decision making. Chebyshev's Theorem indicates the maximum error in calculating a tail area if a distribution is incorrectly identified as a normal distribution.
- Chebyshev's Theorem:
- p = (1 - 1/k2)
Where: p = the lowest possible probability of finding a value between ±k standard deviations from the mean.
Formative Assessment: Calculate the maximum error in tail areas beyond ± 1, 2, and 3 sigma that can be caused by assuming a distribution is normally distributed when it isn't.
From the above, mathematically evaluate why Chebyshev's theorem only has value for making predictions when K > 1.
| Essential Question: How can the area under the bell-curve be determined more accurately than by estimating? |
Determining Areas Under the Normal Distribution By Using Tables
-
Derive the mathematical definition of a z-score (abbreviated as z) using its English language definition and use it for calculate z-scores.
- z-score = number of standard deviations from the mean
-
Find areas under the normal distribution using tables. Note, the tables contain a "standardized normal distribution". Here, the mean = zero and the standard deviation = 1.
Probability = area under curve
Formative Assessment: Find the area under the curve of the normal distribution by using tables.
| Essential Question: How does the box and whiskers plot look like for normally distributed data? |
Working Area Under the Curve Problems Backwards
-
Find z-scores corresponding to LL, Q1, median, Q3, UL of a modified box and whiskers plot for normally distributed data.
Formative Assessment: Draw a box and whiskers plot of a normal distribution.
- Using a normal distribution, estimate a critical value given the probability of finding a value as extreme or more extreme (a tail area).
Homefun (formative/summative assessment): prob. 47, 49, 51, 55 p.132
| Essential Question: How can we tell if a distribution is normal and why would we care? |
Evaluating Normality
-
Evaluate the normality of a distribution by examining histograms, stem plots, dot plots, ogives, or box and whiskers plots.
| Bell shaped | Sym-metrical | Follows 68-95-99.7 Rule | whisker ≈ 1.5 x ( box width) | |
| histograms, stem plots, dot plots | x | x | x | |
| ogives | x | x | ||
| box & whiskers plots. | x | x |
Formative Assessment: Evaluate various data sets to determine if it is reasonable to assume that they are normally distributed.
-
Evaluate the normality of a distribution using a normal quantile plot on a TI-83. n-distributions look like straight lines on normal quantile plots.
Homefun (formative/summative assessment): prob. 65, 67, 69, 75, 71 pp. 134 - 135
| Essential Question: What is the best way to find probabilities associated with normal distributions? |
-
Work quality control reject rate problems. Note: rejects occur in the tail areas.
-
Find areas under the normal distribution using tables using a TI -83 calculator.
normalcdf (L,U,M,S) Have you taken your LUMS today?
Lower value
- Upper value
- Mean
- Standard deviation
-
Given a tail area, find the critical value (see objective 15) using a TI-83 calculator.
invNorm (A,M,S) I think therefore I AMS.
- Area (must be a decimal fraction)
- Mean
- Standard deviation
Remember, in tables for finding standard normal distribution probabilities, the mean = zero and the standard deviation = 1. If these values are input into invNorm along with an area, the result will be a z-score.
Homefun (formative/summative assessment): Work the Chapter 2 practice Test T2.1 to T2.13 138-139
| Essential Question: How can I make an "A" on the test? |
Normal Distributions Review
- Work the practice test.
- Review the objectives.
- Look over free response problems from previous years.
- Master the vocabulary (see example below).
Summative Assessment: Test--Objectives 1-24