| Essential Question: How does the US justice system
compare to statistical analysis? |
Hypothesis or Significance
Testing
-
State the question asked by a significance test
and the two possible answers. Is there clear
evidence of an effect?
- State a generic null
hypothesis.
There is no clear evidence of an
effect.
There is nothing new or out of the ordinary.
The status quo exists.
- State a generic alternative hypothesis.
There is
clear evidence of an effect.
- Give the null and alternative hypothesis for the American justice system.
Null Hypothesis: not guilty. This is the status quo for most people.
Alternative Hypothesis: guilty
- Define P-value.
Assuming Ho is true, the probability of
obtaining a test statistic as extreme or more extreme than the
one obtained is ______.
The smaller the
p-value, the stronger the evidence is against Ho
-
State the statistic used for
indicating the level of significance. (Hint:
it begins with a "p".)
-
State the type of distribution used for tests of
significance. The sampling
distribution.
-
Describe one tail and two tail tests from the standpoint
of the null hypothesis and the p-values.
-
Be as one
with "z-test for a population mean".
-
Perform "z-test for a population mean" in the following ways:
-
by hand (using the
calculator only for basic mathematics) using z-tables.
-
by hand, using the
calculator only for basic mathematics and finding areas
-
using the hypothesis testing features
of the TI-83
-
using Minitab software
Homefun (formative/summative assessment):
Exercise 1, 5, 7, 9, 15, 17 pp. 546 to 547
| Essential Question: Can a statistically significant
hypothesis have no practical value? |
Alpha Levels
-
Define
the significance level, alpha--predetermined maximum acceptable p-value
for rejecting the null hypothesis.
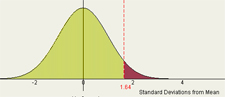
- Use one and two tailed tests of
significance.
one-tailed: area
of tail = alpha
two-tailed: area of each tail = (alpha) / 2
-
Use alpha to evaluate statistical
significance.
-
Use a confidence interval (confidence
level = C) as a
significance or hypothesis test.
significance level =
(1 - C)
a
confidence interval is essentially identical to a 2-tail
hypothesis test.
Formative Assessment: What two types of statistical tools are used for
inference and what type of distribution is used for making inferences?
-
Describe the difference between
statistical and practical significance. Even
a tiny difference between x-bar of a sample and a population will be statistically significant if the sample size is large enough. Such a tiny difference may have no practical significance.
-
State when statistical inference is not
valid. (When based on data from a poorly
designed study or experiment.)
|
 |
Homefun (formative/summative assessment):
| Essential Question: How many ways can you
make an error of judgement? |
Types of
Errors
- Pass the ultimate test of
true statistics nerdhood: Explain the difference
between type 1 and type 2 errors.
- Explain what a type 1 and type 2 error is for the American justice system.
- Ho: innocent, Ha: guilty
- type I
error: punish an innocent person
- type 2
error: let a guilty person go free
- Explain what a type 1 and type 2
error is for quality control in manufacturing.
- Ho: the product is acceptable to the customer
- Ha: the product is unacceptable to the customer
- type I
error: reject acceptable product and don't ship it.
- type 2
error: ship unacceptable product to the customer
-
Generate a truth table for a hypothesis test.
-
State how alpha relates to the type 1 error. Whether a one or two tailed test, alpha always = type 1 error.
-
Name the hypothesis which is
considered true when determining the probability of having a type 1
error.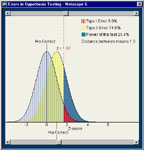 Ho Ho
-
Name the hypothesis which is considered true when
determining the probability of having having a type 2 error. Ha
-
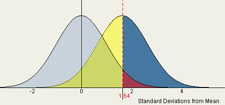
Identify the areas representing the probabilities
of type 2 and type 1 errors on a diagram of a hypothesis test showing a
hypothetical sampling distribution.
-
Determine alpha and beta. beta = type 2 error
Power given: β = (1 -
power)
Special
Cases for β = Type 2 Error |
μHa = μHo: β = (1 - α) |
μHa = (α boundary): β = 50% |
-
Determine the power of a hypothesis test. power = (1 - β)
Beta
given: power = (1 - β)
Special
Cases for Power |
|
μHa = μHo: power = α |
μHa = (α boundary): power = 50% |
-
Plot and interpret a power curve
(power vs. separation between μHo and μHa) for a hypothesis
test.
-
sigmoidal shape
-
at zero separation power = alpha
-
asymptote at 100% (as separation
approaches infinity, power approaches 100%)
-
State how power can be applied to quality testing
in manufacturing.
Homefun (formative/summative assessment):
Exercise 21, 23, 25, 27, 29 pp. 548 to 549
Summative Assessment: Test Objectives 1-27
| Essential Question: How does a confidence interval for
proportions compare to one for means? |
Ch. 12.1 Inference for Proportions
-
State the meaning of p-hat. A statistic estimating a population
proportion
p-hat = |
count of successes in sample |
| count
of observations in sample |
-
Calculate the mean and standard deviation of a
binomial distribution.
| Data Type |
Mean |
Std Dev |
| count or number |
np |
[np(1 - p)]^0.5 |
| proportion |
p |
[p(1 - p) / n]^0.5 |
-
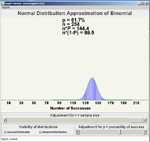
Be aware that a binomial distribution (the
distribution typically used for analyzing proportions) is
essentially a sampling distribution. Note that as a sampling distribution, when the sample size is
large enough (see below), the distribution begins to resemble a
normal distribution.
-
When appropriate, correctly model a binomial
distribution as a normal distribution if the 2 conditions shown
below are met.
np ≥ 10
n(1-p) ≥ 10 |
 |
-
Perform a hypothesis test
comparing a single large sample proportion (p-hat) against a know
population proportion (p). Note, this
is a one proportion z-test.
| Z = |
(p-hat) - p |
| [p(1-p)/n]0.05 |
Homefun (formative/summative assessment): Exercise 35, 39, 41, 43, 47, 57, 59 pp. 562 to 565
| Essential Question: How can we perform significance tests with small samples and an unknown standard deviation for the population? |
Estimating a Population Mean When Its Standard Deviation is Unknown
-
State the 2 assumptions that need to be met for using a t-test.
-
Calculate standard error
of a t-statistic
SE = s / ( n^.5 ) .
-
If the sample size is large, the z-interval can be used with the above SE.
- Explain when a t statistic is used rather than
a z-score.
- Population Standard deviation not known
- Sample Size is Small
-
Calculate t statistics.
-
State the degrees of freedom for a one-sample t-test. df = ( n-1 )
-
Perform one sample t-procedures:
-
by hand (using the
calculator only for basic mathematics) using t-tables.
-
by hand, using the
calculator only for basic mathematics and finding areas.
- tcdf (L,U,D)
- Lower t-value
- Upper t- value
- Degrees
of Freedom
μ is the mean associated with Ha
μo is the mean associated with Ho
- Use the t-distribution with the following limitations:
Sample Size |
Skew |
Nearly N-Distr |
Outliers |
Less than 15 |
None |
Yes |
No |
At least 15 |
Minor |
Yes, minor skew ok |
No |
At least 30 |
Significant |
Yes, skew ok |
No |
Homefun
(formative/summative assessment):
|