|
|
Latin
|
Latin/Greek Root Words
|
|
|
(Statistics
connection) |
|
Regression Significance Testing
AP Statistics Standards
V. Statistical Inference: Estimating population parameters
and testing hypotheses (continued)
B. Tests of significance
7.
Test for the slope of a least-squares regression line
|
|
|
| Essential Question:
Why is finding the slope
of a straight line a big deal? |
The Awesomeness of Slope
|
Famous slopes Mr. R
has known:
-
electrical
conductivity
- COF
- spring constant
-
Plank's constant
- density
- g
- the perfect gas law
constant
- etc. etc. etc
|
Formative Assessment: Using
data from an Einstein's photoelectric experiment find plank's
constant using regression analysis in Minitab. Calculate a
confidence interval on the slope of the line (plank's constant).
Compare this technique to IB error analysis techniques.
|
| Essential Question:
How can you express the
uncertainty in the slope of a line? |
Ch. 14.1 Inference for Regression
Relevance:
Regression analysis (generally multiple regression analysis) is
a very common form of data analysis found in technical journals--often
the primary source of information for research papers. It is not
possible to read and understand them without an understanding of
inference for regression.
- State the 2
inferences drawn when using regression data.
slope (b) & intercept
(a),
these are both parameters, hence, the Greek letters.
- State the assumptions for
regression inference.
- for any x value, y-data is normally distributed.
Remember, Xs are perfect Ys
are not.
- for any x value, the y-data's standard deviation is the same.
See objective 3 below.
- the means of the y-data distribution at any value of x form a
straight line relationship:
my =
a + bx
- Calculate the standard error of the least squares regression
line.
s = [
S(y - ŷ)2
/ (n-2) ]1/2
- Calculate the standard error of the slope.
SEb = s / [ (S(x -
xbar)2 ]1/2
Homefun -- Read section 12.1 Exercise 1, 3, 7, 15 pp. 759 to 762
|
|
| Essential Question:
How can you spot a meaningless
regression anaysis? |
Evaluating
Regression Results for the Slope
- Generate a confidence interval for the slope.
(n-2 degrees of
freedom) Note, b is the estimate of slope from performing regression
analysis.
β
is a parameter and is the actual slope.
b
± t*SEb
- Calculate the t-value for a hypothesis test
of the slope Ho: b
= 0.
(n-2 degrees of freedom)
t = (
b -
0 ) / SEb
or t =
b / SEb
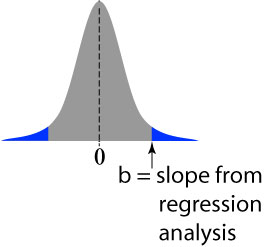
- Perform a significance test for the slope of a least squares regression line.
| Ho: β = 0 Ha: β ≠ 0, β < 0,
β > 0
Note: most
computer programs return a p-value for Ha: β ≠ 0 (see
drawing at right).
For β < 0 or β
> 0, simply cut the p-value in half
|
 |
- Perform a significance test for the
intercept of a least squares regression line.
- Ho:
a = 0
Note: often
a
does equal 0. A high
-
p-value indicates that the intercept
-
is essentially 0. It does not
- necessarily
mean that the intercept is meaningless.
Ha:
a ≠ 0,
a < 0,
a > 0
Note: most
computer programs return a p-value for Ha:
a ≠ 0.
For
a < 0
or
a > 0,
simply cut the p-value in half
- Correctly perform least squares regression
using Minitab.
- Correctly interpret least squares regression
computer output (such as from Minitab).
Homefun -- Read section 12.2 Exercise
33, 35,37 pp. 786 to 788
|
|
| Essential Question:
How can you account for
variability in a predicted data point from a regression analysis? |
Evaluating
Regression Results for a Given y-hat
- Generate a
confidence interval for the
average y-hat give from
averaging numerous y-values
obtained at a specific value of x.
(n-2 degrees of freedom)
y-hat ± t*SEμ-hat
SEμ-hat = s [ 1/n + ( x* - x-bar )^2 / (S(x -
xbar)2) ]^0.5
- Generate a
prediction interval
for a y-hat
from
a single y value
obtained at a specific value of x.
(n-2 degrees of freedom)
y-hat ± t*SEy-hat
SEy-hat = s [ 1 + 1/n + ( x* - x-bar )^2 / (S(x -
xbar)2) ]^0.5
|
|
|
| Stats
Investigation: How to Spot a
Meaningless Regression Analysis - time approx 2 class
periods (individual work) |
Purpose: Determine if a regression analysis using random
numbers that has a high r-square value can be detected with
hypothesis tests on the slope and intercept.
Instructions: Remember the
stats investigation you did earlier in which you determined
that even random data can produce a high r-square value.
Redo the regression/correlation analysis in Minitab on the 4
sets of data you saved and interpret the results. Be
sure to take all the recommended steps for producing a
statistically significant regression analysis.
Questions /Conclusions:
- Based on your data, could you spot
randomness with the hypothesis tests on the slope and
intercept of the regression equation. Explain
- Outline all the steps which should be taken to produce
a regression/correlation analysis with the best chance of
being meaningful.
- Can a thorough statistical analysis of
bivariate data, by itself
fully establish that a regression result is meaningful?
Explain
|
|
|
|
| Essential Question:
How can we evaluate or include
possible lurking variable in a
regression anaysis? |
Ch. 14
-
Perform multiple linear
regression analysis using Minitab and correctly interpret the
regression equation, R2, and the hypothesis tests.
-
State how you would plot and interpret
residuals for a multiple regression analysis.
Remember, a residual = (yi - yhat).
Although there are several x-variables each with its own value, there
is only one y-value and only one yhat. Hence, the residual is normally
plotted against the y-value.
Classfun:
Chapter 8, AMSCO book Review Exercise 1-6 p. 254, 1-7 p. 257, 1-6 259,
1-5 262
Homefun -- Chapter 12 practice test (all parts) pp. 796 to 798
Cumulative AP Practice Test pp. 799 to 806
|
|
|
|